The Penman-Monteith equation for reference evapotranspiration (ET0) is the internationally accepted standard for quantifying the atmospheric demand for water from a vegetated surface. It is the foundation of most scientifically grounded irrigation scheduling systems, including CropKern's water balance engine. But the equation has five required inputs - not just temperature - and when any of those inputs is missing, estimated, or spatially unrepresentative of the field in question, the resulting ET0 can be meaningfully wrong. This article explains what the formula requires, which inputs are most commonly mis-specified in field applications, and what that means for irrigation scheduling accuracy at the parcel scale.
The Five Inputs to Penman-Monteith
The FAO-56 Penman-Monteith equation for daily ET0 requires: (1) net radiation at the crop surface (Rn), typically derived from measured solar radiation and a surface albedo assumption; (2) soil heat flux (G), typically small and often set to zero for daily calculations; (3) mean air temperature (T), ideally at 2 m height; (4) wind speed at 2 m height (u2); and (5) vapor pressure deficit (VPD), which is the difference between the saturation vapor pressure at the measured air temperature and the actual vapor pressure, calculated from relative humidity or dew point temperature.
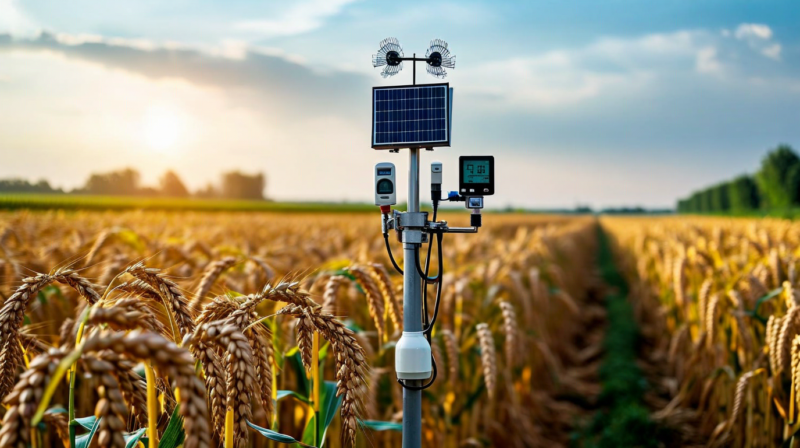
Of these five inputs, solar radiation and wind speed are the two most frequently either missing or estimated from distant stations in agricultural ET calculations. Many weather stations in the USDA SCAN network and ASOS network measure temperature and humidity but not solar radiation. When solar radiation is unavailable, it can be estimated from clear-sky radiation models and cloud cover fraction, but this adds uncertainty that is particularly large on partially cloudy days - which are also the days when ET demand is most variable spatially within a county. Wind speed is even more spatially variable than radiation and is frequently estimated from the nearest surface station, which may be 20 or more kilometers from the field of interest.
Wind Speed Error and Its Effect on Computed ET
In the Penman-Monteith aerodynamic resistance term, wind speed at 2 m height appears in the denominator of the vapor pressure deficit contribution. On a day with high VPD (2.5 to 3.5 kPa) and strong wind (4 to 6 m/s at 2 m), the wind-driven component can account for 40 to 50 percent of total ET0. If wind speed is estimated from a station 25 km away and the true field-level wind speed differs by 1.5 m/s - well within the range of normal spatial variation in an unobstructed agricultural landscape - the ET0 error on that day is approximately 0.6 to 0.8 mm. Across a month of above-average VPD and wind, daily errors of this magnitude compound to a 15 to 20 mm monthly ET error. That is a non-trivial fraction of the 120 to 180 mm of summer monthly ET demand for irrigated corn.
CropKern's ET pipeline uses a weighted-average approach across the nearest three weather stations, with weighting by inverse distance, elevation difference, and terrain shelter coefficient. For operations with on-site weather stations that measure solar radiation and wind speed, we recommend connecting those stations directly to the CropKern data API for use as the primary ET0 source for all parcels within approximately 5 km. The onboarding process includes a station data quality check that flags systematic biases in radiation or wind readings before the station is used as a primary ET0 source.
Vapor Pressure Deficit and Irrigation Timing
Vapor pressure deficit (VPD) quantifies how dry the air is relative to its saturation capacity. On a 32 C day with 40 percent relative humidity, VPD is approximately 2.5 kPa. On the same day at 60 percent humidity, VPD drops to 1.5 kPa, and ET0 decreases by roughly 25 percent. VPD is calculated from temperature and relative humidity, both of which are measured at most standard weather stations, so the VPD input to Penman-Monteith is typically more reliably estimated than wind speed or solar radiation.
For irrigation scheduling, VPD matters not just as a daily input but as a predictor of near-term demand. When the 48-hour forecast shows sustained high VPD (above 2.8 kPa daily mean), CropKern's scheduling engine treats this as a pre-emptive trigger condition, as discussed in our article on management allowed depletion thresholds. The VPD forecast comes from NWS hourly output at the nearest grid point and is updated every six hours. For operations in areas with significant local VPD microclimate effects - irrigated valley floors versus dry hillsides adjacent to the same field - the NWS grid point may not capture local VPD variation adequately, and an on-site humidity sensor adds meaningful forecasting precision.
Crop Coefficient (Kc) Calibration by Hybrid and Year
ET0 is the reference evapotranspiration from a standard short grass surface. Actual crop ET (ETc) requires multiplying ET0 by a crop coefficient (Kc) that accounts for the specific crop's surface resistance, albedo, and aerodynamic roughness relative to the reference surface. For corn, the FAO-56 single crop coefficient curve runs from approximately 0.30 at planting to 1.15 at peak vegetative cover, declining back toward 0.35 at black layer. The mid-season Kc of 1.15 applies to a fully established, healthy, well-irrigated corn canopy with LAI above 3.0.
In practice, Kc should vary by hybrid canopy architecture. Modern stay-green hybrids with higher LAI and longer grain fill duration have a slightly flatter Kc peak and a later start to the decline phase compared to older hybrid genetics. Hybrids bred for high yield in irrigated environments also tend to have higher peak transpiration demand per unit LAI than their dryland counterparts. CropKern's Kc implementation uses a GDD-based single crop coefficient curve calibrated on Corn Belt growing conditions, with adjustments for LAI derived from satellite NDVI measurements at each parcel. When satellite-estimated LAI diverges from the standard curve - for example, in fields with early-season canopy stress - the Kc adjustment reduces ETc accordingly, preventing over-irrigation into a partially developed canopy.
Common ET Estimation Errors and Their Downstream Effects
The most consequential ET estimation errors in irrigation scheduling are: (1) using daily mean temperature when the formula requires the separate maximum and minimum (daily mean underestimates ET by 5 to 8 percent in high-diurnal-range conditions); (2) applying the grass reference Kc values to corn without the height correction for aerodynamic resistance (corn at 2.5 m creates significantly more turbulent mixing than the 0.12 m reference surface, which increases the sensible heat component and can increase ETc by 5 to 12 percent at full canopy in windy conditions); and (3) using a fixed monthly Kc table rather than a GDD-linked curve, which systematically mistimes the Kc transitions in early or late planted fields.
All three of these errors are systematic biases, not random noise, which means they do not cancel out over time. An irrigation scheduler that consistently uses daily mean temperature underestimates ETc by 5 to 8 percent across the season. For a 160-day growing season with mean ETc of 5 mm/day, this translates to an estimated 40 to 64 mm of under-counted ET demand. At field capacity soil moisture and a MAD threshold of 38 percent during reproductive stages, that 40 to 64 mm deficit is enough to trigger 1 to 2 additional irrigation events per season that the model is missing entirely. The result is that the soil profile is consistently drier than the model predicts, and yield losses attributable to crop water stress are occurring at a rate the scheduler cannot see. If you want to audit your current ET data source for these issues, contact [email protected] to review your parcel's ET log against the weather station records.